What Is It
PerfView is a free performance analysis tool designed to pinpoint CPU and memory-related issues. While primarily a Windows tool, it also supports analyzing data from Linux systems. It’s versatile across many scenarios and offers specialized features for troubleshooting .NET runtime performance. For Counter-Strike 2 (CS2) players, PerfView can be an effective tool for optimizing gameplay or gathering detailed diagnostics to share with the CS2 development team for further feedback.
When You Shouldn’t Use PerfView
Special thanks to @ZPostFacto for sharing the tutorial on how to use PerfView specifically for diagnosing performance issues in Counter-Strike 2 (CS2)! He says:
An ETW trace is usually NOT the right tool for investigating problems such as:
Fletcher Dunn,
- My average FPS is slower than it used to be.
- Most of the time my FPS is 500, but sometimes it drops to 450.
- I am getting packet loss.
For more posts from our wonderful Fletcher, please see his X account below.

Tutorial On How To Use PerfView To Collect Information Causing Stutters
Important. If you take the time to capture a trace according to the instructions below, it’s usually possible to identify the cause of the hitch. If you skip any steps, it is not worth the effort. Please read the instructions carefully and use them. Fletcher adds that:
We usually DON’T need to know your system specs, or that you have an awesome computer, or a super fast Internet connection, or that the problem is only with our game, etc. Save yourself the time and include ALL of the information above, but ONLY the information above.
Fletcher Dunn
Step 1: Shutdown All The Undeeded Apps
Very often the problem we find is caused by other software running on the user’s computer or a customization the user has made. Before sending us a trace, run the game in the “plainest” way possible.
- Close down all unneeded apps. Open up Windows task manager and look for processes that do not look like part of windows or Steam. For example:
- LED applications.
- FPS monitoring / tuning tools like rivatuner, MSI afterburner
- Photoshop, creative cloud
- Nvidia share
- Xbox game bar
- Yes, even discord! We want our game to work well with all popular apps and tools. But this is an important diagnostic step. If the problem only happens while a popular app is running, it’s OK to submit a trace – just mention this important clue. We share traces with other developers, if the problem happens to be in their software.
- Remove “tweaks” to game options
- Convars that cannot be modified by the in-game UI should be left at the default value.
- Settings made via in-game UI are fine, unless obviously related to performance or smooth gameplay, such as network buffering, etc.
- Keybinds are OK.
- Graphics settings are OK if the setting can be made using the in-game UI. But it’s a good idea to try lowering your quality settings and see if the problem goes away. Even if you think the game should run fine at the higher settings, it is very useful to know whether the problem still happens at lower settings.
- Command line arguments should be removed.
- -vulkan is OK, but always try the game with both DirectX and vulkan
- Check your autoexec.cfg, if any.
- If you aren’t sure if it’s performance related or not, try resetting it.
- Remove all “optimizations” you have made to your computer.
- If you are adjusting process priorities, using process lasso, etc, turn that off.
- Have you overclocked your computer? Try turning that off.
- Make sure your graphics drivers are up-to-date.
- Reset all graphics driver options to the default.
- Nvidia control panel -> Manage 3D settings -> Restore
Very often, the above steps lead to a solution. Even if not, they can be a useful diagnostic step. Do not skip them!
Everybody makes mistakes, but if we see evidence that you haven’t taken these basic steps to rule out external causes, we will assume that investigating your trace will not be a good use of our time, and we won’t look at it.
Counter-strike players: Turn on the in-game telemetry HUD and observe the max frame time in ms. What does it usually read when gameplay is smooth? What does it spike up to when there is a hitch? Please include this information in your report.
Step 2: Important Privacy Notice
While you are recording, the tool may be capturing keystrokes, full pathnames of files that are accessed, DNS lookups, etc, across your whole system, not just the game. It may be possible to tell what websites you visit while recording. (But please close all browsers, anyway.) We really, honestly do not care what websites you visit, and it’s unlikely we will have the time or interest to seek out data of that nature. But we might stumble across it accidentally. For our sake and yours, please act as if somebody is looking over your shoulder while recording the trace.
- Don’t do anything private.
- Don’t type in any passwords, credit card numbers, etc!
Step 3: How To Capture An ETW Trace
- Download and install perfview from here: https://github.com/microsoft/perfview/blob/main/documentation/Downloading.md
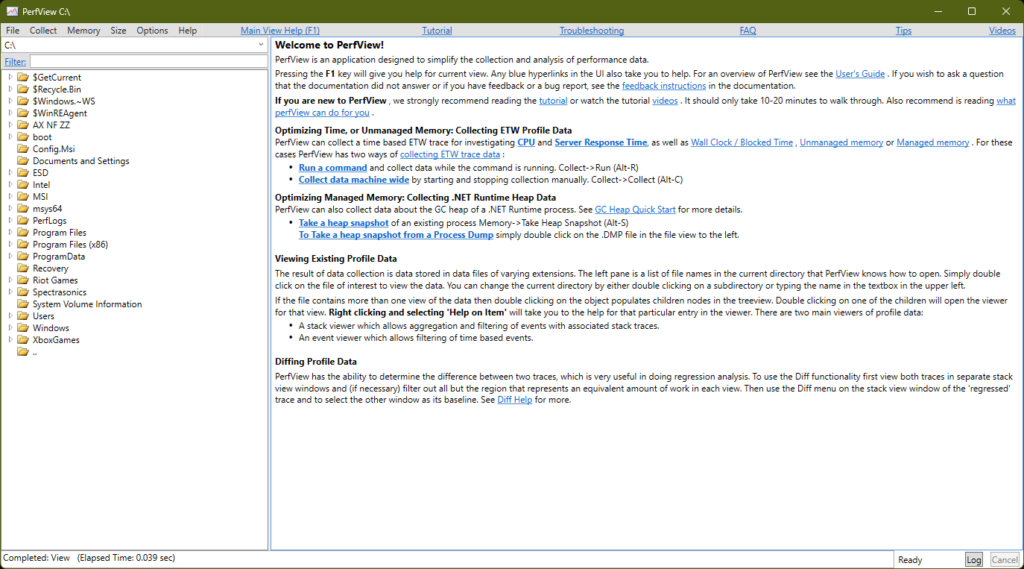
- Run perfview.exe
- Select the menu option Collect -> Collect

- Note the output filename so you’ll know where it is writing the data
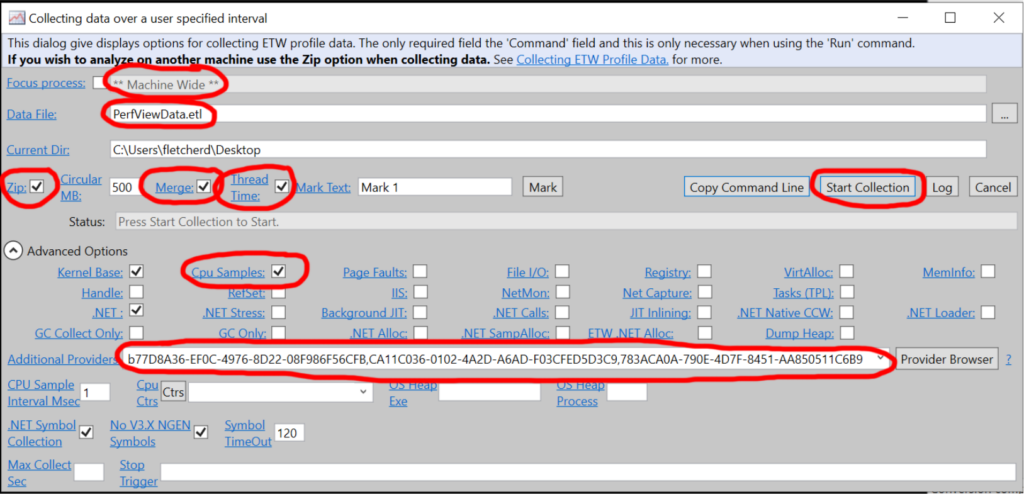
- Confirm all the circled options, but especially:
- Check the “Thread Time” checkbox.
- Check the “Cpu Samples” checkbox
- In “Additional providers”, paste this long string of text EXACTLY. (The screenshot above has different text and is out of date.) There must not be any spaces:
*Valve.SteamNetworkingSockets,*Valve.Source,*Valve.Source.Net,*Valve.Source.Client,*Valve.Source.Input,*Valve.Source.Render
- Don’t click “start collection” yet. Launch the game, load the map, etc first. Don’t profile the app starting up or any loading code, unless the problem is specifically with that. This will help keep the trace file small, and makes it easier to find the problem.
- You read the privacy notice above, right?
- When gameplay is smooth, alt-tab back to perfview and click “Start collection”
- Reproduce the problem.
- You can leave the trace running indefinitely while you attempt to reproduce the problem. However, if you change maps or switch to a different server, please stop the trace and start a new one. If possible, please start the trace when gameplay is smooth.
- Click “Stop collection” soon after the problem happens. Don’t try to capture multiple examples of the problem. A single example that is easy to locate is much more helpful.
- If you checked the Zip checkbox (recommended), perfview will zip everything up for you.
- Upload the trace somewhere. (Dropbox, google drive, etc.)
- Double check the permissions to make sure we will be able to access it. (Tip: open your link in a private/incognito browser.)
- Through a private channel such as email, reddit PM, etc, send us a link to the file, so we can download it. Do not share this link publicly!
- IMPORTANT: Include this information in your communication to us:
- Counter-strike players: include the max frametime in ms from the telemetry HUD that you were getting before the hitch, and also what it spiked up to when the hitch occurred.
- A brief description of the problem. Was it one big pause? If so, how long did it last? Or did the frame rate just drop very low? If so, can you estimate what the frame rate was and how long the period of bad performance lasted? “Game is laggy” or “My framerate used to be fast, but now it is slow” might be true statements, but will not help us solve the problem. Try to be specific about the nature of the problem.
- VERY IMPORTANT: How much time elapsed between when the problem happened and when you clicked “stop collection:” This is extremely useful to help us locate the problem in the trace timeline.
- We usually DON’T need to know your system specs, or that you have an awesome computer, or a super fast Internet connection, or that the problem is only with our game, etc. Save yourself the time and include ALL of the information above, but ONLY the information above.
- Once we have confirmed that we’ve downloaded the trace, delete it.
- If you take the time to follow these instructions carefully, and include all of the information above so that the problem appears near the end of the trace and we can locate it, then we usually will be able to understand what the problem is.

